
Go With The Flow - Part 2
/
Amaral and his colleagues at NU’s McCormick School of Engineering and Applied Science knew that there was plenty of information buried in the data about player movement, passing and timing, if only a logical model could be created to explain the chaos on the field. Just as we learned in Part 1 about network models in basketball, Amaral, a lifelong soccer fan from Portugal, used his knowledge of social network analysis in biological systems to create a model of soccer ball strategy.
"You can define a network in which the elements of the network are your players," Amaral said. "Then you have connections between the players if they make passes from one to another. Also, because their goal is to score, you can include another element in this network, which is the goal."
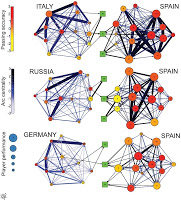 |
| Diagram 1 (click to zoom) |
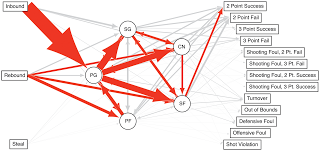
"We looked at the way in which the ball can travel and finish on a shot," said Amaral, who also is a member of the Northwestern Institute on Complex Systems (NICO). "The more ways a team has for a ball to travel and finish on a shot, the better that team is. And, the more times the ball goes through a given player to finish in a shot, the better that player performed."
In Diagram 1, take a look at the bold network connections representing the most used passing paths between Euro 2008 players (denoted by their uniform numbers). Just as in the basketball network paths, finding passing patterns that end with shots on goals can give clues to the most efficient ball movement.
 |
| Diagram 2 (click to zoom) |
In fact, by the time Euro 2012 came around last year, the model was able to attach an average player rating for each team. Diagram 2 shows the table for Spain’s champion roster which most pundits would agree ranks the players in a logical order from top to bottom.
This focus on data analytics is the new standard for sports and those teams that accept the challenge to find athlete monitoring tools that reveal these trends and patterns will have the competitive advantage over those teams that do not. Indeed, with apologies to Sun, the network is now the sport.